Win more deals with "The Response Time Reality Check Report"
A lead fills out your website form at 2:00 PM. A sales rep changes the status from "New" to "Open - Not Contacted" at 4:30 PM the same day—about 2.5 hours later. Not bad, right? But then that lead sits in "Open - Not Contacted" status until 10:00 AM the next day before the rep actually makes first contact. Total time from inquiry to contact: 20 hours.
Here's the uncomfortable truth: that lead probably talked to three of your competitors in those 26 hours. One of them responded in 15 minutes. Guess who's most likely to win that deal?
Response time isn't just a metric. It's often the first impression that determines whether a prospect becomes a customer or a statistic in someone else's win column. This report measures exactly how fast—or slow—your team responds to new opportunities, and the results often surprise people who assumed they were doing fine.
Why Response Time Matters More Than You Think
When someone reaches out to your company, they're signaling intent. They have a problem, they're actively looking for solutions, and they're comparing options. The window of engagement is remarkably short. Studies consistently show that leads contacted within the first hour are significantly more likely to convert than leads contacted even a few hours later.
The psychology is straightforward. When prospects reach out, they're in decision mode. They're researching, comparing, and ready to engage. The company that responds first gets to frame the conversation, understand the requirements, and build rapport while competitors are still checking their inboxes.
Speed also signals operational excellence. A fast response suggests you're organized, attentive, and care about customer needs. A slow response—even if the eventual conversation is great—creates doubt. If they take this long just to respond to my inquiry, what will service be like after I'm a customer?
Example in Practice: Two software companies compete for the same client. Company A responds to the demo request in 45 minutes with a personalized message and proposed times for a call. Company B responds 18 hours later with a generic "we'll be in touch soon" message. Even if Company B has a better product, Company A has already established themselves as more responsive and customer-focused. The prospect forms opinions based on responsiveness before they ever evaluate the actual solution.
This dynamic applies to both sales and support. A customer with an urgent issue judges your company by how quickly someone acknowledges their problem. Speed doesn't mean you've solved it yet—it means you've demonstrated you care and you're on it.
What This Report Actually Measures
The Response Time Reality Check Report tracks two critical time windows in your lead response process. Both windows matter, and both reveal different aspects of how your team operates.
The first measurement captures acceptance time—how long a lead sits in "New" status before a sales rep claims it by changing the status to "Open - Not Contacted." This measures your team's responsiveness to new opportunities landing in the system. A lead sitting in "New" status is essentially unowned and ignored, waiting for someone to take responsibility for it.
The second measurement captures contact time—how long the lead remains in "Open - Not Contacted" status before the rep actually reaches out and changes it to "Working - Contacted." This measures the gap between claiming a lead and actually doing something about it. A rep might accept a lead immediately but then let it sit for days before making contact.
Both metrics matter because they reveal different behaviors. Fast acceptance with slow contact means reps are claiming leads to prevent others from taking them but aren't actually following through promptly. Slow acceptance with fast contact means leads languish in the queue before anyone notices them, but once claimed, they get handled quickly. The ideal pattern is fast on both metrics—quick acceptance and quick contact.
The status-based approach makes this measurement straightforward. You don't need to track activities or build complex formulas to find first contact dates. The status changes themselves create clear timestamps that mark each stage of the process.
💡 Key Insight: Separating acceptance time from contact time reveals whether your bottleneck is in lead distribution (nobody claiming leads) or in follow-through (people claiming leads but not contacting them). These are different problems requiring different solutions.
Building the Report
Implementation Difficulty: ⭐⭐⭐☆☆ (3/5)
Development Required: Declarative tools with workflow automation
Creating this report in Salesforce requires tracking status changes over time. The good news is that if your team follows the process consistently—changing status from "New" to "Open - Not Contacted" to "Working - Contacted"—the data you need is already being captured.
This solution requires creating custom fields and building automation to populate them. You'll need administrator access to create fields and Flow Builder experience to trigger timestamp updates. No Apex code required—this can be built entirely with declarative tools available to administrators. Expect 2-3 hours for initial setup including testing.
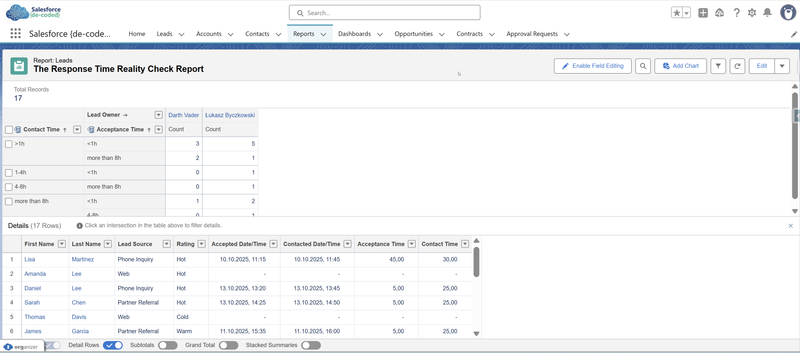
Start by creating a new report using the Leads report type. You'll need these fields: Lead Name, Lead Owner, Current Status, Created Date, and Lead Source.
The challenge is capturing when status changes happened, not just what the current status is. Salesforce doesn't automatically store status change timestamps in standard fields. The cleanest approach is to create custom date/time fields on the Lead object that automatically capture when status changes occur.
Custom Timestamp Fields:
Create two custom date/time fields on the Lead object:
- "Accepted Date" - populated when Status changes to "Open - Not Contacted"
- "Contacted Date" - populated when Status changes to "Working - Contacted"
You'll need a Flow to automatically populate these fields when the status changes occur.
Formula Fields for Time Calculations:
Next, create two formula fields on the Lead object to automatically calculate the time differences:
- Acceptance Time - calculates the hours between when the lead was created and when someone accepted it
- Contact Time - calculates the hours between when the lead was accepted and when contact was made
These formulas do the math automatically so you don't have to calculate time differences manually. You can set them up to show hours or minutes depending on what's more useful for your team.
Building the Report:
Once these fields exist, create a Leads report and add your timestamp fields along with the calculated time fields. Group by Lead Owner to see individual performance, and use averages to understand typical response times across your team.
Filter the report to show leads from a relevant timeframe—last 30 days, last quarter, whatever makes sense. You might want separate views: one showing only leads that have been accepted (Status is not "New"), and another showing only leads that have been contacted (Status = "Working - Contacted" or further along).
Using Bucket Fields for Response Time Categories
To make the report more readable, create bucket fields that group response times into meaningful categories. In your report, click the dropdown arrow next to your "Acceptance Time" or "Contact Time" column and select "Bucket this Column."
Create buckets with these ranges:
- Quick Response: Less than 1 hour
- Standard Response: 1 to 4 hours
- Delayed Response: 4 to 8 hours
- Very Delayed: Greater than 8 hours
These buckets let you quickly see patterns. You can group your report by these buckets to see how many leads fall into each category, or use them in charts to visualize response time distribution. The bucket approach makes it easier to spot systemic issues—if 40% of your leads fall into "Very Delayed," that's a clear signal something needs attention.
You can create separate buckets for acceptance time and contact time, allowing you to analyze each metric independently. For example, you might discover that acceptance time is mostly "Quick" but contact time is mostly "Delayed," revealing where your bottleneck actually exists.
Example in Practice: Your report shows that acceptance time averages 3 hours—pretty good. But contact time averages 22 hours. This reveals that reps quickly claim leads to show activity but then don't actually reach out promptly. The bottleneck isn't in lead assignment; it's in follow-through after acceptance. This insight leads to implementing daily reminders for reps with leads in "Open - Not Contacted" status for more than 4 hours.
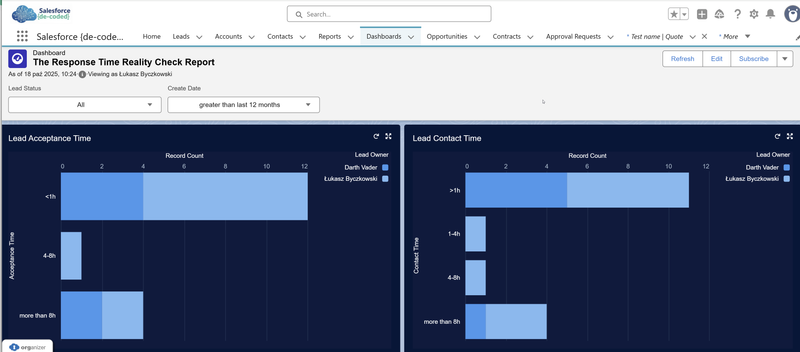
Making It Visual with Dashboards
While the report contains all the data you need, reading through rows of numbers can be tedious. Create a dashboard that visualizes these metrics graphically. Dashboards make patterns immediately obvious and are much easier to review during team meetings.
Add components like bar charts showing average response times by owner, gauge charts displaying team-wide averages against targets, or donut charts showing the distribution across your bucket categories (Quick, Standard, Delayed, Very Delayed). The visual format makes it easy to spot outliers and trends at a glance.
The real power of dashboards is the ability to drill down. When you see something concerning in the chart—like one person with unusually high contact times—you can click through to see the actual lead records behind that number. This drill-down capability lets you move from high-level patterns to specific examples quickly, making it easy to have detailed conversations about individual cases when needed.
Filter the report to show leads from a relevant timeframe—last 30 days, last quarter, whatever makes sense. You might want separate views: one showing only leads that have been accepted (Status is not "New"), and another showing only leads that have been contacted (Status = "Working - Contacted" or further along).
What the Data Usually Reveals
Most organizations that run this report for the first time discover interesting patterns in how their team actually operates versus how everyone assumes it operates. The dual metrics—acceptance time and contact time—each tell their own story.
First, there's usually a significant difference between the two metrics. Acceptance time might be fast while contact time lags, or vice versa. When acceptance is fast but contact is slow, it suggests reps are claiming leads to meet activity expectations but aren't actually prioritizing follow-through. When acceptance is slow but contact is fast, it indicates leads sit in limbo before anyone takes ownership, but once claimed, they get handled promptly.
Second, individual patterns vary dramatically. Some reps accept leads immediately and contact them within hours. Others let leads accumulate in "New" status, then batch-accept several at once and work through them slowly. These different approaches often reflect workload management styles or simply different interpretations of urgency. Neither is necessarily wrong, but the visibility helps managers understand who operates how.
Third, lead source matters significantly. High-value lead sources—like event attendees or demo requests—typically see faster acceptance and contact times. Generic website inquiries or downloaded content leads often languish longer. This pattern reveals which lead sources your team takes seriously and which ones they consider lower priority, regardless of what your official lead scoring says.
Fourth, the time-of-day and day-of-week patterns reveal operational realities. Leads arriving Friday afternoon often don't get accepted until Monday morning. Leads coming in after business hours sit longer than those arriving during peak working hours. These patterns show gaps in coverage or simply the human reality that people prioritize what's in front of them over what's accumulating in the queue.
Fifth, you'll discover "status squatters"—leads that sit in "Open - Not Contacted" for days or weeks. These are leads a rep accepted but never actually contacted. Sometimes it's because the lead went cold or didn't respond to initial attempts. Other times it's simply neglect. Either way, these leads clutter the pipeline and create inaccurate activity metrics.
Example in Practice: Your report shows that your team's average acceptance time is 2 hours and average contact time is 8 hours—both seem reasonable. But when you look at individual performance, you notice one rep has acceptance time of 6 minutes but contact time of 48 hours. They're gaming the system by immediately claiming leads to look responsive, but then not following through. Another rep has acceptance time of 12 hours but contact time of 30 minutes—they're slower to claim leads but excellent at follow-through once they do. Both patterns need addressing, but for different reasons.
From Data to Action
Running the report is step one. Actually improving response times requires using the data to drive changes. Here's where this gets practical.
Start by establishing baselines and targets for both metrics. What's your current average acceptance time and contact time? What should they be based on your industry and customer expectations? A B2B enterprise sales team might target 4-hour acceptance and 24-hour contact. A high-velocity inside sales team handling inbound leads might aim for 30-minute acceptance and 2-hour contact.
The key is setting separate targets for each metric because they represent different behaviors. Fast acceptance matters for lead ownership and preventing leads from going stale. Fast contact matters for actual customer engagement and conversion.
Share the data transparently. Individual accountability matters, but public shaming doesn't improve performance—it just makes people defensive. Focus on patterns rather than calling out individuals unless there are clear performance problems requiring direct management attention.
Use the insights to fix process issues. If acceptance times are slow, maybe your lead notification system isn't working effectively. If contact times are slow despite fast acceptance, maybe reps are overloaded and need better workload distribution. If certain lead sources get slower treatment, fix the routing or adjust how those leads are prioritized.
Address the "status squatters" directly. Leads sitting in "Open - Not Contacted" for more than your target threshold need attention. Either the rep should contact them immediately, or they should be reassigned to someone who will. Create automated alerts when leads stay in this status too long.
Consider implementing service level agreements (SLAs) based on the data. Once you know what's realistic, you can set expectations: "All leads will be accepted within 2 hours and contacted within 8 hours during business days." Then build automation that flags violations and escalates when necessary.
Track improvement over time. Run this report monthly or quarterly and compare results. Are both acceptance and contact times improving? Are outliers becoming less common? Is the variance between team members narrowing? Most importantly, is the gap between acceptance and contact time shrinking? These trends tell you whether your interventions are working.
💡 Key Insight: The most effective use of this report is making it routine rather than occasional. When teams know response time is measured and visible regularly, behavior changes naturally. The report creates accountability simply by existing and being shared consistently.
The Uncomfortable Conversations This Report Enables
This report often surfaces issues that people were aware of but hadn't quantified. Now the data makes the problem undeniable and forces conversations that were previously avoidable.
You might discover that your highest-performing rep by closed deals has excellent acceptance times but terrible contact times because they claim leads quickly but then cherry-pick which ones to actually contact first. That forces a conversation about follow-through and consistent treatment of all leads.
You might find that your newest team member has the fastest response times because they're eager to prove themselves, while tenured reps have become complacent. That's a coaching opportunity disguised as performance data.
You might realize your lead routing automation isn't actually working the way everyone assumed. Leads are supposed to round-robin evenly but actually pile up on specific people because the logic doesn't account for time zones or vacation coverage.
These conversations are uncomfortable because they reveal gaps between intentions and reality. Nobody thinks they're slow to respond. Nobody believes they ignore certain types of inquiries. The data shows what people actually do versus what they think they do.
The discomfort is productive. It leads to concrete improvements: clearer ownership, better routing rules, modified workloads, additional training, or sometimes just heightened awareness that changes behavior immediately.
Making This Report Part of Your Operation
The real value of the Response Time Reality Check Report comes from making it a regular part of your operational rhythm rather than a one-time analysis.
Add it to your monthly or quarterly business reviews. Track both acceptance and contact time trends over time. Are you getting faster or slower on both metrics? If you've implemented changes based on previous reports, did they work? The longitudinal view shows whether you're improving or backsliding.
Make both metrics visible to team members without making it a punitive scorecard. When people can see their acceptance time and contact time compared to team averages, many will self-correct without management intervention. Nobody wants to be the obvious outlier on either metric.
Use the report to inform resource allocation. If acceptance times are consistently slow during certain times or days, maybe you need different coverage. If contact times lag despite fast acceptance, your team might be overloaded and need additional resources or better prioritization tools.
Consider building this into compensation or recognition programs if both acceptance and contact speed truly matter to your business outcomes. What gets measured and rewarded gets attention. If you want fast lead acceptance and prompt follow-through, acknowledge and appreciate people who deliver both consistently.
The report also helps set realistic customer expectations. If your actual average time from inquiry to contact is 12 hours (combining acceptance and contact time), don't promise 2-hour responses in your marketing materials. Use the data to align promises with delivery capabilities.
The Bottom Line
Speed wins. Not always, not automatically, but often enough that both acceptance time and contact time deserve serious attention. The Response Time Reality Check Report makes both patterns visible, measurable, and improvable.
Your team probably won't love seeing this data broken into two metrics, especially initially. Nobody enjoys discovering they're fast to claim leads but slow to actually contact them, or that they let leads sit unowned for hours before accepting them. But the awareness this dual-metric approach creates typically leads to meaningful improvements in customer experience, conversion rates, and operational efficiency.
Build the report. Track both metrics. Run it regularly. Share it transparently. Use it to drive constructive changes in both lead acceptance and follow-through. Your customers will notice the difference even if your team grumbles about the accountability.